Managing module or package dependencies is an important design activity that helps to keep a software project maintainable. Visualizing these dependencies is a good way of getting a first impression on a project and for exposing design problems. In this article we're going to create a basic visualization for a Java project.
To avoid parsing Java code we use Classycle for the heavy lifting. Classycle analyzes class files and - among other useful features - creates an XML report:
java -jar classycle.jar -packagesOnly -xmlFile=analysis.xml example.jar
The XML report contains dependency information in a format that we can easily convert into something that other tools (like graphviz or Gephi) can work with. We'll be using dot(1) from the graphviz package.
Here's a small Python script for converting the XML to dot syntax:
#! /usr/bin/env python
import sys
import xml.etree.ElementTree as ET

doc = ET.parse(sys.stdin)

print 'digraph G {'

for p1 in doc.findall("./packages/package"):
    n1 = p1.get("name")
    for p2 in p1.getchildren():
        n2 = p2.get("name")
        if p2.get("type") == "usesInternal" and n1 != n2:
            print '  "%s" -> "%s";' % (n1, n2)

print '}'
We run the script using Classycle's report as input:
python to-dot.py < analysis.xml > graph.dot
The result is a directed graph that looks something like this:
digraph G {
  "pkg1" -> "pkg2";
  "pkg1" -> "pkg3";
  "pkg3" -> "pkg1";
}
Pretty simple, but there is a lot more we could do in the Python script, like annotating edges with the number of dependencies or displaying only packages that are part of a cycle (see dot's manpage for details). If you're more ambitious you can hit the problem with a graph processing package like NetworkX.
For the final step we use dot(1) to turn the ASCII graph into a PNG file:
dot -T png -o graph.png graph.dot
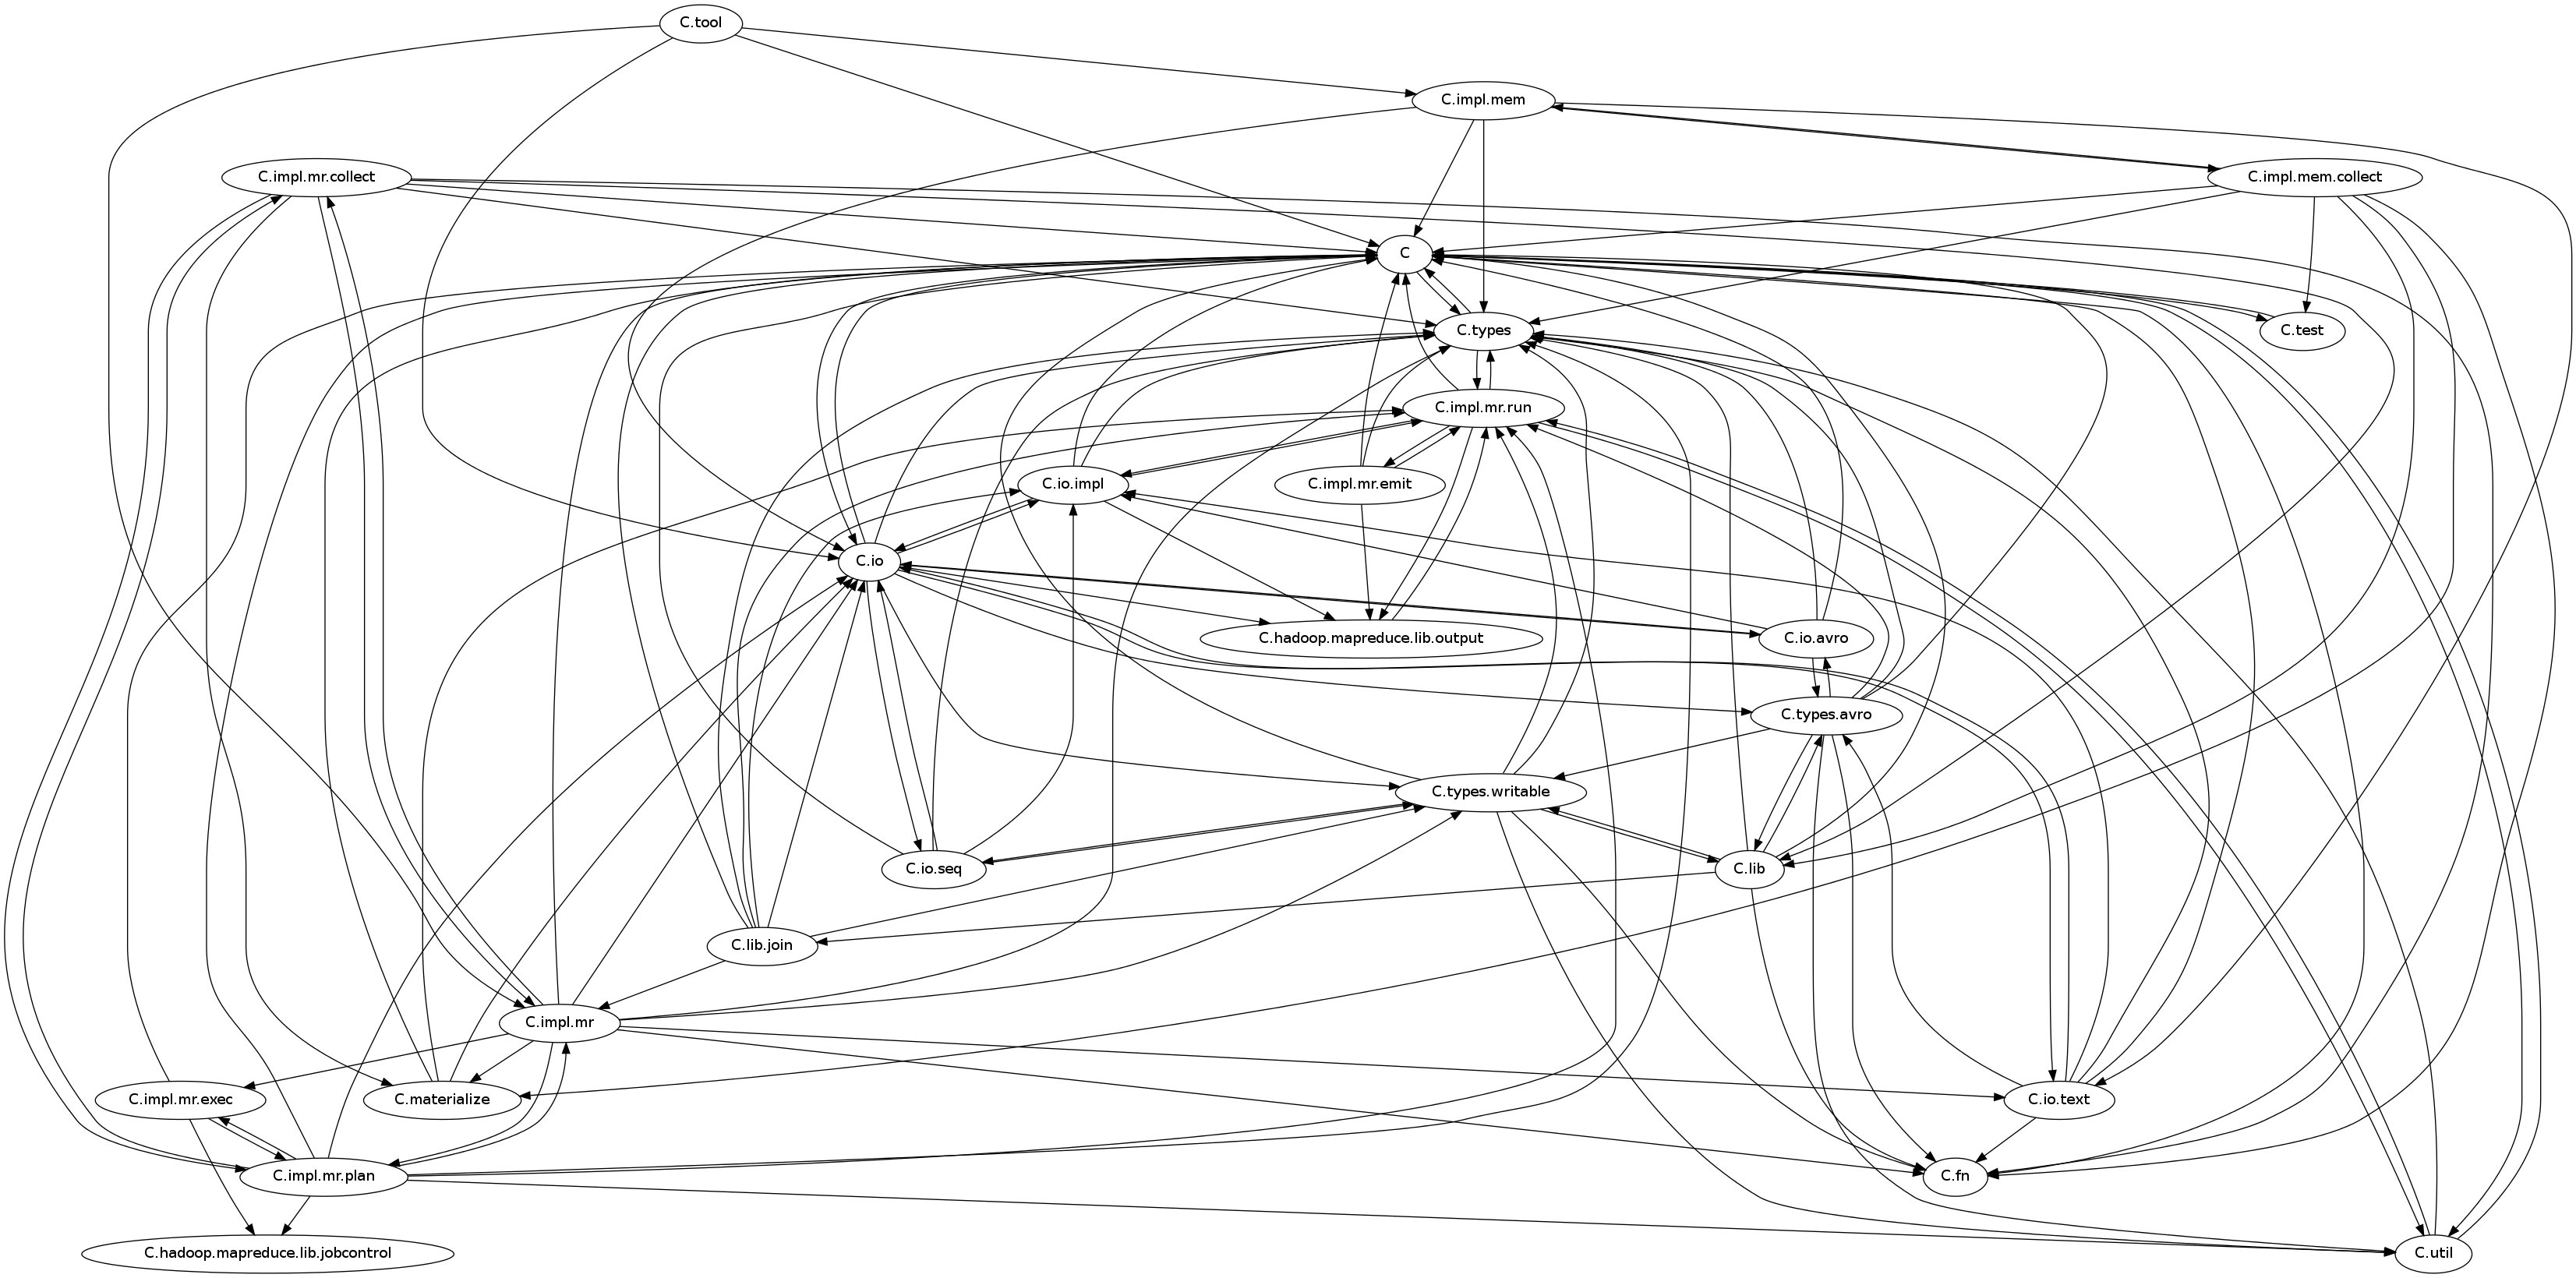
Here's an example graph generated from an Open Source project (package names have been shortened):
The project is relatively small with 170 classes spread over 30 packages. Event though the graph looks pretty chaotic with lots of cyclic dependencies, this is still a lot better than many other projects I've seen. If you don't use tools like Classycle or Sonar right from the start to enforce your design then these kinds of problems will sneak in eventually and it takes a lot of work to get them fixed.
